
Camunda Insurance Blog
Your Insurance Claims Process Is Losing Customers: 5 Critical Warning
This blog is designed to walk you through the process of pinpointing and resolving performance issues in a B2B Integrator.
Signs of a slow-performing application can manifest in different ways, including unusual
In such a scenario, the initial step involves checking the accessibility of the Queue Watcher UI, which is the monitoring interface packaged with Sterling Integrator.
If the Queue Watcher responds, it serves as a valuable tool for pinpointing the root cause of the issue.
Utilized for comprehending the current internal activity of the primary B2B processing engine, the QueueWatch interface aids in the identification of problematic code and provides insights necessary for accurately tuning the application.
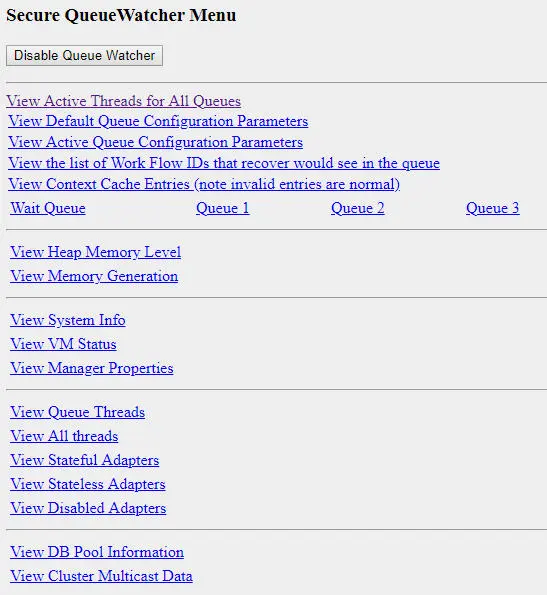
Access Queue Watcher by navigating to https://yourB2BServerHostname:Port/QueueWatch.
To gain insights into the ongoing processes, click on the first link titled “View Active Threads for All Queues.“
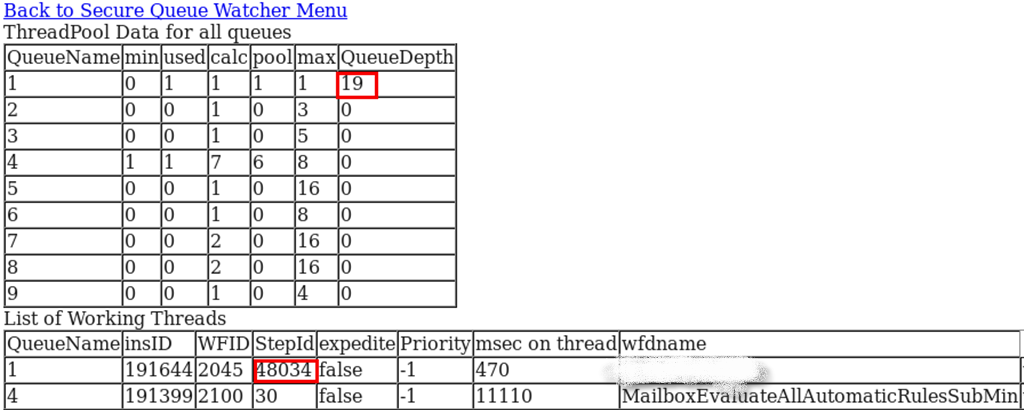
From this point, you can observe all presently active processes, displayed at the bottom under “List of Working Threads,” along with the processing backlog indicated by “Queue Depth.”
In the provided illustration, 19 Business Processes are in queue 1, awaiting execution threads, with a maximum capacity of 1 thread. It is evident that the currently executing Business Process is sluggish, characterized by a substantial number of steps (i.e., 48034).
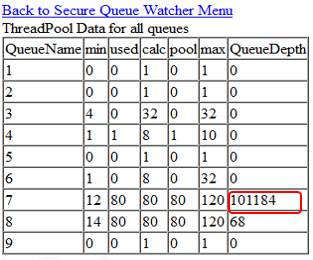
Here’s another example below, illustrating a scenario where over 100,000 business processes are queued in queue 7. This queue is currently utilizing 80 execution threads out of a maximum capacity of 120:
Queueing is a standard practice in the application, serving the purpose of ensuring efficient workload processing within the limits of current system resources and the configured maximum global threads. These queues are adaptable and can be fine-tuned to give priority to specific tasks.
It is also possible to change the queues configuration dynamically in Queue Watcher without restarting the application (tip unknown to many users). The dynamic changes, obviously, will be lost after restart.
For lasting modifications to the queue configuration, ensuring persistence between restarts, employ the Performance Tuning Wizard accessible through the Dashboard interface (Operations/System/Performance/Tuning). These changes can be saved in costumer_overrides.properties to make them permanent.
Dynamic adjustments to the queues can aid in promptly clearing queues under specific circumstances.
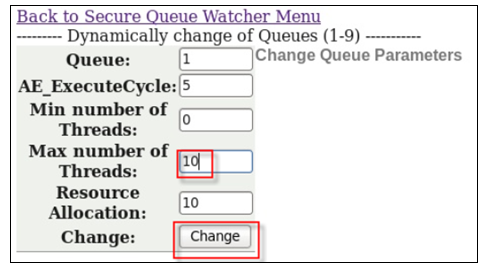
Here’s how to dynamically alter the queues configuration:
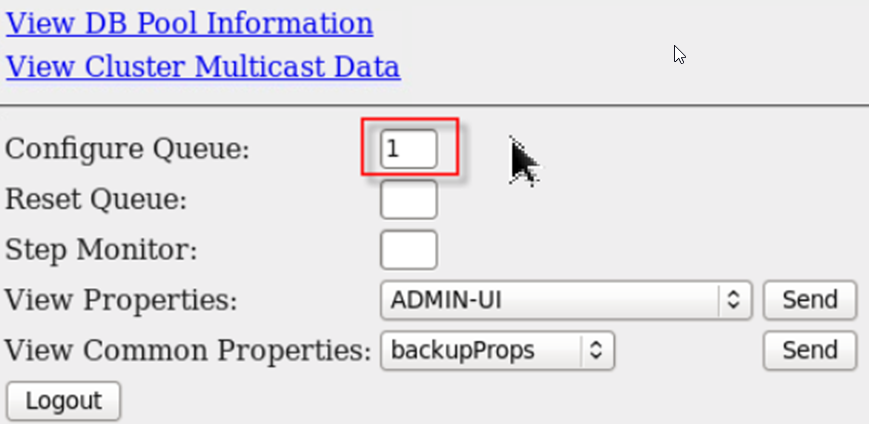
To enhance parallel processing, it’s necessary to modify the queue configuration to allow for a greater number of threads to run concurrently. In the given example, the maximum number of threads for Queue 1 was adjusted from 1 to 10:
Return to the “Active Threads for All Queues” page.
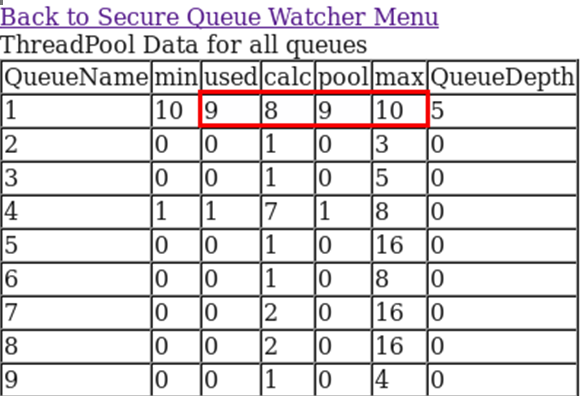
You should now notice the presence of multiple threads running concurrently:
While this post won’t delve into the details of tuning system queues, the tip provided could prove highly beneficial in certain scenarios.
Now, let’s revisit the initial question: Why is the application experiencing slow performance?
If you observe that the Business Processes (BPs) are taking longer than usual, you can inspect the thread execution stack trace (second tip):
On the Queue Watcher main page, locate the option for “View Queue Threads” —
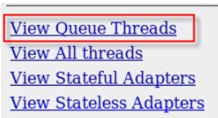
Subsequently, click on the “stacksize” link, identified as the 13th link in blue below:

Now, you can examine precisely what your Business Process (BP) is doing.
In the provided example, it is evident that the thread is in a TIMED WAITING state. By scrutinizing the method details, it becomes clear that the code is currently within the SleepyService.
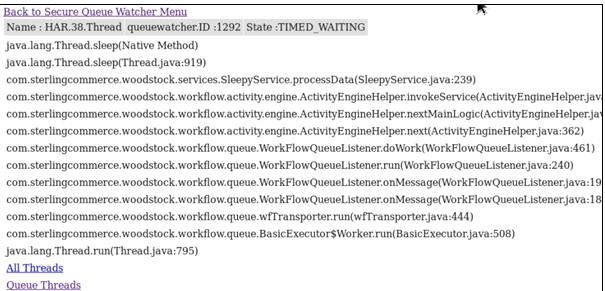
In the second example below, it is apparent that the Business Process (BP) is engaged in performing some database operations —
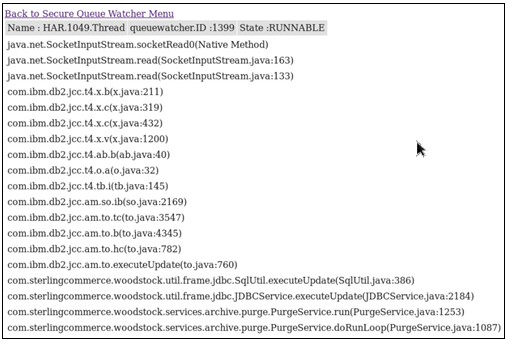
Following this, you can refresh the stack trace page to ascertain whether the Business Process (BP) is progressing or consistently stuck in the same operation. This provides an initial insight into where to focus your investigation.
Slowness can have different causes like:
Search for errors in critical categories such as Heap space, Out-of-Memory (OOM), JVM errors, database issues, file system (FS) problems, DNS errors, connectivity issues, and network errors within the application logs.
Initiate the investigation by examining logs related to noapp, system, sci, and perimeter if the slowness is pervasive across the entire system.
In addition to utilizing administration interfaces, you have the option to directly identify executing processes through standard operating system utilities.
For Linux, employ the top process monitor with the command “top -H.” The “-H” switch alters the default view from top processes to top threads.
In the provided screenshot, the thread “WFE.37.Thread” is utilizing a significant portion of the CPU.
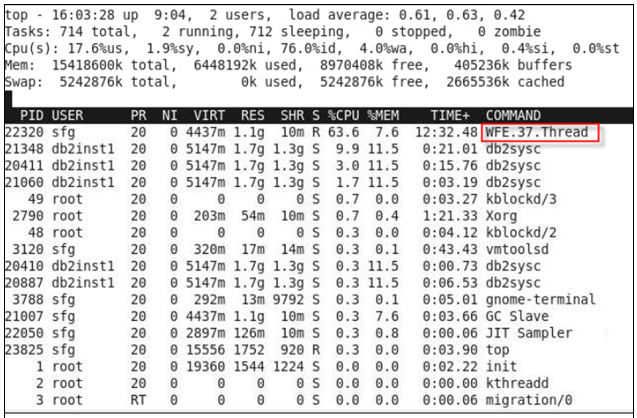
Leveraging OS tools like top offers a rapid way to pinpoint processes affecting your system. Have you observed the inclusion of workflow IDs in the thread names?
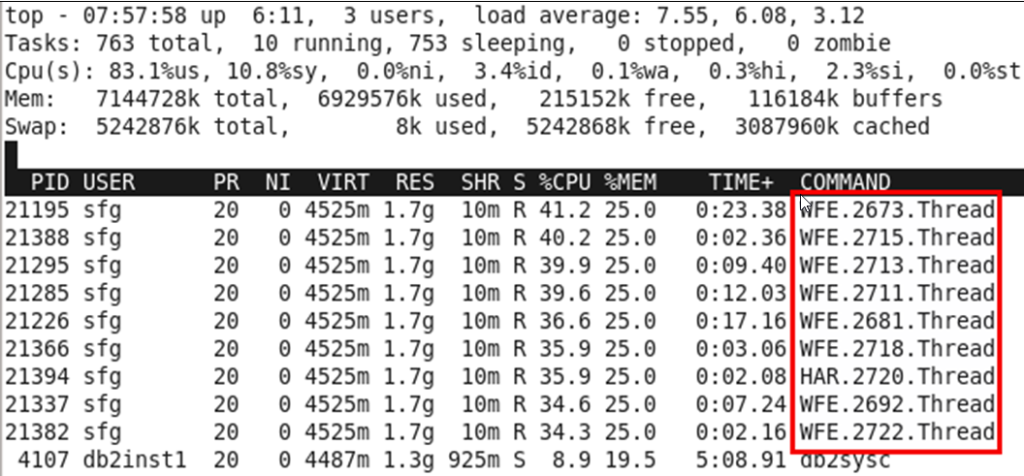
The ‘top‘ command is typically available in most Linux environments. For other operating systems, equivalents are generally accessible, though they may not always be included in standard builds.
If the top output is showing system threads rather than BP threads, always think of taking a few thread dumps of the application to share with customer support. And never forget to look at the application logs!
An effective approach to identify the most resource-intensive application methods is through JMX (Java Management Extensions) monitoring.
SQL queries can be instrumental in identifying long-running processes and steps within the application.
Installing IBM Maximo APM - Asset Health Insights
What's new in IBM Maximo APM - Asset Health Insights 7.6.1
Browse Categories
Share Blog Post

Your Insurance Claims Process Is Losing Customers: 5 Critical Warning

IBM Sterling Is Not the Bottleneck Your Architecture Is Introduction

From Visual Data to Intelligent Decisions: How AI-Powered Visual Inspection
| Cookie | Duration | Description |
|---|---|---|
| cookielawinfo-checkbox-analytics | 11 months | This cookie is set by GDPR Cookie Consent plugin. The cookie is used to store the user consent for the cookies in the category "Analytics". |
| cookielawinfo-checkbox-functional | 11 months | The cookie is set by GDPR cookie consent to record the user consent for the cookies in the category "Functional". |
| cookielawinfo-checkbox-necessary | 11 months | This cookie is set by GDPR Cookie Consent plugin. The cookies is used to store the user consent for the cookies in the category "Necessary". |
| cookielawinfo-checkbox-others | 11 months | This cookie is set by GDPR Cookie Consent plugin. The cookie is used to store the user consent for the cookies in the category "Other. |
| cookielawinfo-checkbox-performance | 11 months | This cookie is set by GDPR Cookie Consent plugin. The cookie is used to store the user consent for the cookies in the category "Performance". |
| viewed_cookie_policy | 11 months | The cookie is set by the GDPR Cookie Consent plugin and is used to store whether or not user has consented to the use of cookies. It does not store any personal data. |
Thank you for submitting your details.
For more information, Download the PDF.
Thank you for registering for the conference ! Our team will confirm your registration shortly.
Invite and share the event with your colleagues
IBM Partner Engagement Manager Standard is the right solution
addressing the following business challenges
IBM Partner Engagement Manager Standard is the right solution
addressing the following business challenges
IBM Partner Engagement Manager Standard is the right solution
addressing the following business challenges